Some examples of Fourier approximation
The following are some pretty pictures to help visualize Fourier
approximations, as discussed in Bill Faris' Math 511B (Real Analysis) course of
spring 2006.
The context is real periodic functions on the interval from -π to
π. For each of the eight functions below, the Fourier coefficients are
estimated for n from -20 to 20:
The Nth approximation is
 These approximations are plotted for N from 0 to 20, along with the
original function.
These approximations are plotted for N from 0 to 20, along with the
original function.
Last, the Fourier coefficents cn are plotted vs. n,
for n from -20 to 20.
Color scheme:
- For the function plots, the function is in blue.
- For the approximation plots, the original function is in blue, the
constant-term approximation is in red, and then other colors are used for
higher-order approximations.
- For the coefficient plots, real parts are in blue and imaginary parts are
in red.
All the computations here are done numerically using the following Python
script: four1. In this script, Fourier
coefficients are estimated using naive quadrature (on a mesh of 400 points
uniformly spaced from -π to π), as familiar from freshman calculus.
Plots were made by piping the output from the four1 script to the xgr program.
John Kerl, 2006-03-06
Here is the piecewise "hat" function which has value 1 between
-π/2 and π/2, and 0 outside (with period 2 π).
- Note that the constant term raises the level to 1/2. This is the average
value of the function.
- Also note that the horns (these are called Gibbs phenomena in the
engineering community) do not get appreciably lower (although they do
get narrower) as |n| increases. This reflects the mathematical notion
(as explained by Dr. Faris) that the convergence is in the zero-measure sense
rather than in the pointwise sense.
- This is an even function, whereas cosine is even and sine is odd.
Thus, as we expect, the Fourier coefficients here have imaginary parts
(approximately, due to the numerical technique) equal to zero.
Function and approximations:
Fourier coefficients:
Function data,
approximation data,
coefficient data.
Here is the function f(x)=x (with period 2 π).
- This is an odd function, so here the Fourier coefficients have zero real
part.
- The Fourier coefficients decay rather slowly to zero as |n|
increases, as reflected in the homework assignment where we computed the
coefficients analytically.
- Here too, the horns narrow but do not appreciably shorten as |n|
increases.
Function and approximations:
Fourier coefficients:
Function data,
approximation data,
coefficient data.
Here is the function f(x)=π - |x| (with period 2
π).
- Like f(x)=x, this is not smooth. However it is
continuous. Note that the Fourier coefficients go to zero more quickly than
for the previous, discontinuous function.
Function and approximations:
Fourier coefficients:
Function data,
approximation data,
coefficient data.
Here is the function f(x)=1/(1+x2), with
period 2 π.
- This could be made truly periodic using the Poisson formula.
However the periodization would contribute little numerically,
since f(x) is already nearly zero toward the edges.
- This is a smooth function (if written on the real line rather than
on the circle ...), and the coefficients drop off rather quickly
as seen in the coefficient plot.
- This can also be seen in the approximation plot, where the successive
approximations get indistinguishably close to the original function
after about the 5th term or so.
Function and approximations:

Fourier coefficients:

Function data,
approximation data,
coefficient data.
Here is the function f(x)=cos(x).
- This function is exactly a cosine with integer frequency.
- The n=1 and n=-1 terms contribute all the energy, and
reproduce the function exactly. The higher-order terms contribute nothing at
all.
- The nth basis function is einx =
cos(nx) + i sin(nx). Since cosine is even and sine is
odd, for -n we have cos(-nx) + i sin(-nx) =
cos(nx) - i sin(nx). Thus it takes the n=1 and the
n=-1 terms, each with coefficient 1/2, to obtain the cosine part while
canceling the sine part.
Function and approximations:

Fourier coefficients:
Function data,
approximation data,
coefficient data.
Here is the function f(x)=cos(1.7x+0.4).
- This function is a cosine, but with non-integer frequency.
- The coefficient plot shows most energy at
|n| = 1 and |n| = 2, which makes sense since these two
integer frequencies bracket the 1.7.
- The higher-order terms are non-zero.
- Note that the first few Fourier coefficients have appreciably non-zero
imaginary part. This is because, while the cosine function is even,
it is no longer even after the phase shift.
- Since the argument to cosine is 1.7x + 0.4, this function when
written with period 2 π is not continuous. This fact is reflected
by how the approximations behave near the edges.
Function and approximations:
Fourier coefficients:
Function data,
approximation data,
coefficient data.
Here is a function which (very simplistically) represents John, Paul,
George, and Ringo doing the "LAHH" of the "lah-lah-lah-LAHH" from Twist
and Shout. This is f(x)=cos(4x) + cos(5x) +
cos(6x) + 1.2cos(7x).
- By the 7th term, the original function has been approximated exactly.
- These transforms are all discrete; I have done the plots with connected
dots for visual convenience. In the coefficient plot, you see amplitudes
1/2, 1/2, 1/2, and 1.2/2 at n at 4, 5, 6, and 7, respectively.
(The factors of 1/2 are for the same reason as the cos(x) example.)
This provides visual confirmation of the linearity of the transform.
Function and approximations:
Fourier coefficients:

Function data,
approximation data,
coefficient data.
Here is the function f(x)=exp(-π x2),
written with period 2 π.
- This is a Gaussian. Here we have visual confirmation that the
transform of a Gaussian is another Gaussian.
- As with 1/(1+x2), periodization using the Poisson formula
would contribute little numerically since the bell curve already falls off
to zero near the edges.
- In general, the narrower the original Gaussian, the wider the transform
and vice versa.
- The transform looks pointy. This is because the original function
is plotted on a mesh of 400 points from x from -π to π, whereas
I am only showing 41 Fourier coefficients, namely, for n from -20 to
20.
Function and approximations:

Fourier coefficients:
Function data,
approximation data,
coefficient data.
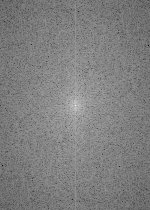
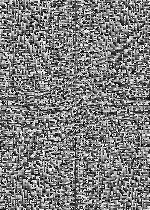
Here is a photo, right-clicked from Dr. Faris' web site, along with its
2D discrete Fourier transform.
Technical notes:
- The original image was a color 210x150 JPEG.
- I converted to PPM (uncompressed) format using the Linux utility
jpegtopnm.
- PPM files contain RGB triples, with red, green, and blue encoded
as 0 to 255. Using a little Perl script, I averaged the RGB triples for
each of the 210x150 pixels, obtaining greyscale data.
- This was converted to floating-point and run through a 2D discrete
Fourier transform, with source code
here.
- The second image is complex magnitude of the Fourier coefficients,
with logarithmic scaling.
- The third image is complex phase of the Fourier coefficients,
with phase taken to be in the interval [-π, π).
- The floating-point FFT output was converted to PPM format using
xfim .
- Then, the GIMP program was used to convert the PPM files to JPEG format.
Mathematical notes:
- You can think of a 2D discrete Fourier transform as being on the
torus, sampled with M points along rows and N points along
columns.
- I put the zero frequencies at the center. Since the JPEG file contains
values from 0 to 255, the image mean is certainly non-zero. That explains
why the center spot is the brightest.
- The magnitude-of-transform plot was done using logarithm of complex
magnitude of Fourier coefficients. This permits the high-frequency
(off-center) components to still be seen. Otherwise, all but the center
spot would appear black.
- For the phase plot, -π is black and π is white.
- Most of the transform energy is toward the center. This indicates that
low-frequency components (such as facial features) are predominant. (The
transform would be different if, say, we had a picture of a picket fence.)

See also:
http://www.cs.unm.edu/~brayer/vision/fourier.html
← Back